
I have been quiet because I have been trying to work out what happened to Visio to make the twisted line pattern I created at the beginning of the year corrupted.
I should have taken a screen shot when it worked. It seems that there is now extra fill. Hopefully the Visio team can figure it out.
Actually, I did take a screen shot. It was on the download page for the line pattern.
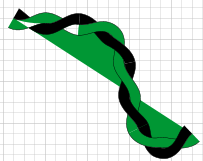
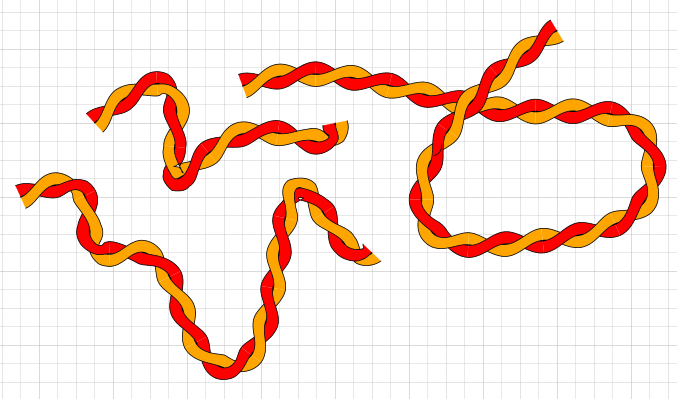
The Visio team are quick. The line pattern no longer bleeds fill!
Anyway, today I noticed a poster in Answers was asking about creating OrgCharts. The OP wanted to be able to add extra fields to the drawing.
The answer by the MS agent covers the basics by referring to https://support.microsoft.com/en-us/office/create-an-organization-chart-in-visio ,
but needs more details.
That article does mention that you can add extra fields, but does not explain how to expose these new fields in the drawing. It does mention how to add columns for new fields…
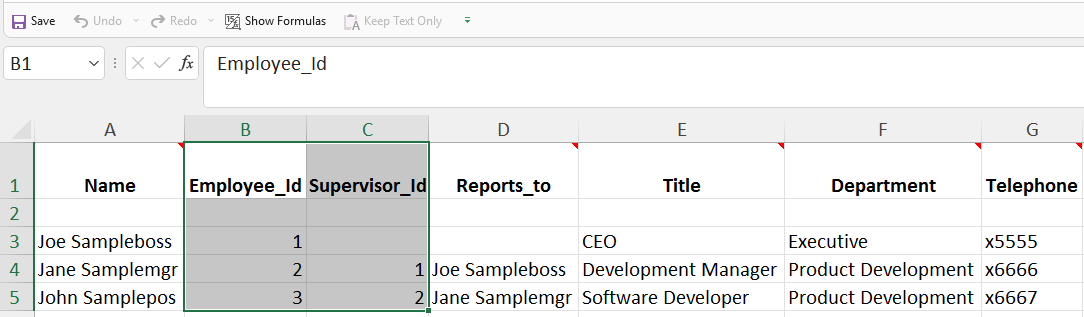
but the new information is only visible if you select a shape and open the Shape Data Window,
So the shape needs to be modified to expose this new information. For those new to Visio, Visio uses masters and what the shapes you see in a drawing are instances of a master. You can create a drawing without masters by using the drawing tools, but usually a shape has a master. So rather than adding the new information to a hundred shapes, you can just change a few masters so they expose the content of their new Shape Data. If you want to change the masters, you should create copies and leave the originals untouched.
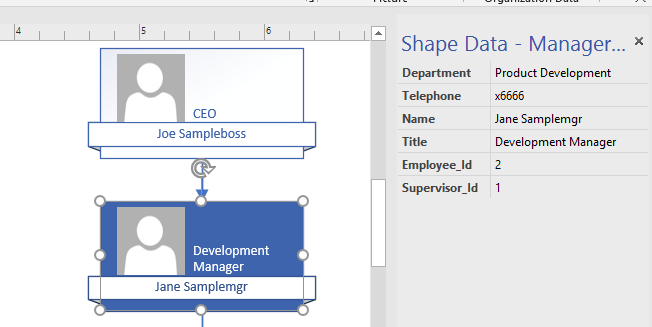
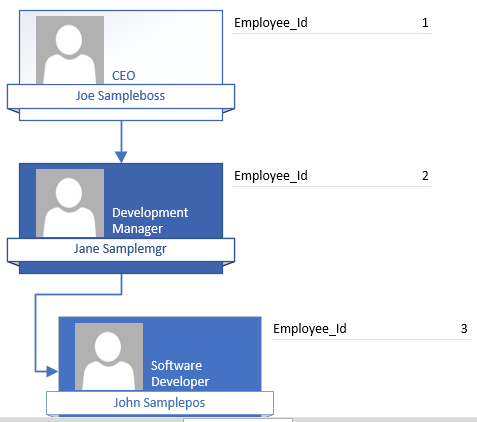
An alternate way is to use Data Graphics. These are shape embellishments that range from text to graphics that can appear around the shape. Select the shapes and chose Advanced Data Graphics from the Data tab…. and then Create New Data Graphics…
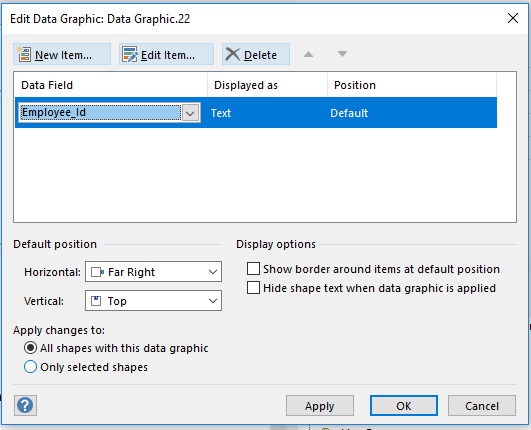
which results in …
John… Visio MVP in x-aisle
JohnVisioMVP.ca
