I needed to create a new shape that was a series of dots, from zero to six. The shape had one property that determined the number of dots. The easy way would be to create a series of circle shapes, group them and control the visibility of each dot from the group shape. I tend to prefer Chris’s method, minimize the number of shapes. So, how could I create this as a single shape? I could join the circles into a single shape and set the NoShow cell for each Geometry section. This worked, but the pattern of dots were a straight line for one to three, but four was two rows of two and five and six were also two rows. So, I needed a way to control the location of the dots because the dots were not always in the same place.
The circle are just ellipses with the major and minor axes the same length. I needed to understand Ellipse Row and the values of the X,Y,A.B,C,D cell values. The current documentation just says that A,B and C,D are points on the ellipse, but as pointed out on the Visio Guy forum, two points do not uniquely identify an ellipse.

With a little playing it turns out that they are where the major and minor axes intersect with the ellipse. There are two intersection points for each axis, but Visio only needs one for each. Since the center is also on the minor and major axes, the two points can give the slope and the other intercept can easily be found.
So how to explore the values? The easiest way is just to use Visio. Create a circle and open its’ shapesheet and play with it. The real fun Visio way is to add a Controls section and use the control handles to play with the Ellipse. So add a Control section to the shapesheet with three rows.
(Try and set the circle and its’ position to whole numbers to avoid dealing with fractions.)
Set the values of the first row to the X and Y values from the Ellipse row. Set the values of the second row to the A and B values and the third to the X and Y values.
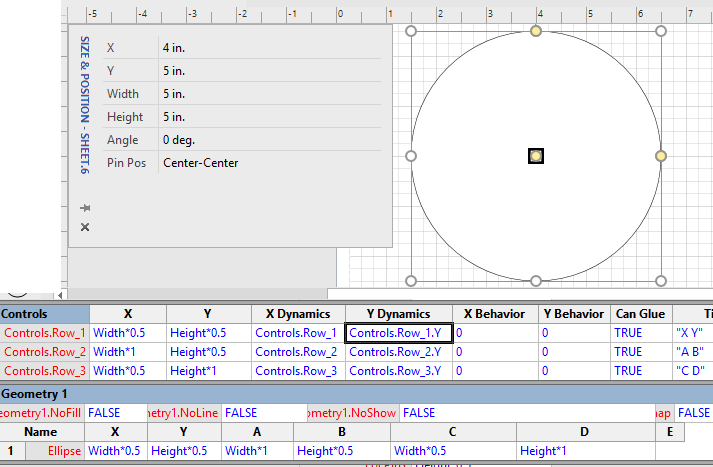
Finally set the X, Y, A, B, C, D cells in the Ellipse row to point to the cells from the Control rows.

Set the shapesheet to show values. You now have a shape to play with that will show you what happens when you change the values of X,Y A,B and C,D. The open shapesheet set to values will show the values.
Save the shape as a master so it can be reused.
John… Visio MVP in x-aisle
JohnVisioMVP.ca
