
Earlier this month, someone asked if there was a Visio shape of the US segmented by states. The user wanted to add data to the states (Data Connectivity) and colour the states depending on that data (Data Graphics – Colour by Value). My usual recommendation is to find a suitable image in SVG format. I have done this for a few maps.

Visio Guy did point out that Visio does have a US map segmented by states. At one time you could separate the states and then reassemble them like a jigsaw puzzle, but for some reason that is no longer possible. If you want just the New England states, you have to start with the full map and delete the other states.
Actually, after playing with the shapes, I did find User cells that indicate that the shapes can be aligned but was unable to see how.
The Visio US Map shapes does contain the name of the state as Shape Data. So, if I was going to add Data connectivity, I would need more Shape Data and a better key than the state’s name. Luckily, the US Postal Service has standard two letter abbreviations for the states.
So, the first thing to do was get a list of the abbreviations. Luckily, I found https://www.50states.com/abbreviations.htm. The table was the basis for the Excel data I was going to use.

The map did point out that I may have issues with the smaller states and that I would have trouble with Alaska if I tried to keep everything to scale. (Alaska is a lot bigger than Texas.)
In the sixties, I had a disagreement with a substitute teach from Texas. He was trying to convince me that Texas was the largest state. The disagreement ended with me having to serve a detention the next week. On the Saturday, I went downtown to the US embassy reading room. Being a capital city and that it was a short walk, it was no big deal. While there, an elderly man asked about what I was researching. He offered to write me a note. So, on Monday morning, I went to school armed with a letter written on US embassy stationary, signed by the US ambassador stating Alaska was bigger (and a real state).
No detention. 😉
Loading the Visio US map showed other issues.

To get the lower 48 states to fit a letter size landscape page, I needed to scale the image and I needed to shrink Alaska.
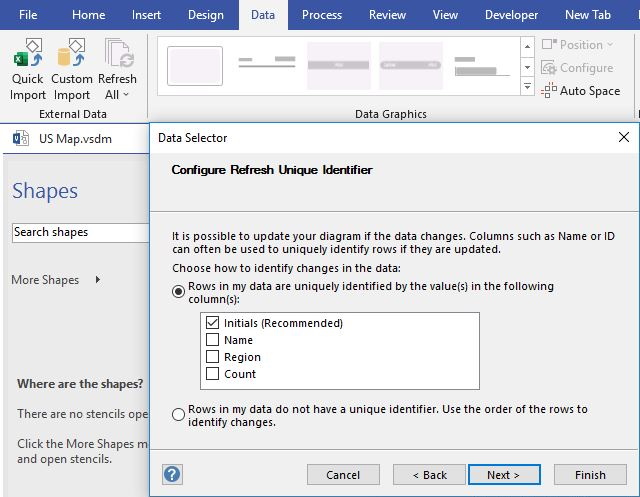
I am not a big fan of the Sheet.nn names and decided to change the names of the shapes to their state initials.
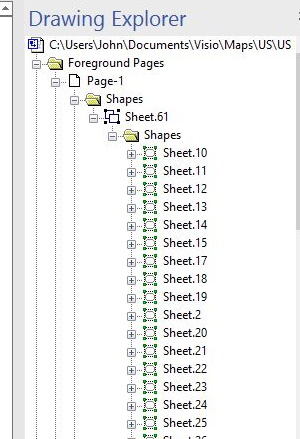

To be able to do that, I ran a Visio report that listed the Shape Id and the Shape Data of the state names. I then merged it with the list of Initials and names from the website. I then ran some VBA code to remove the existing Shape Data, rename the shapes from Sheet.nnn to the appropriate Initials, add the new Shape Data and populate the Shape Data Initials. I also included Shape Data for Region and some sort of count.
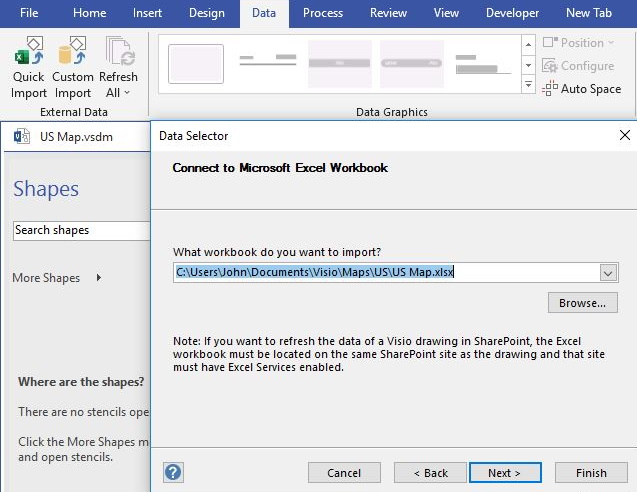
So, I now had an Excel sheet of Initials, names, Region and Count. The last two are unpopulated. Of course, with Data Connectivity, I only needed a key to populate the other fields.
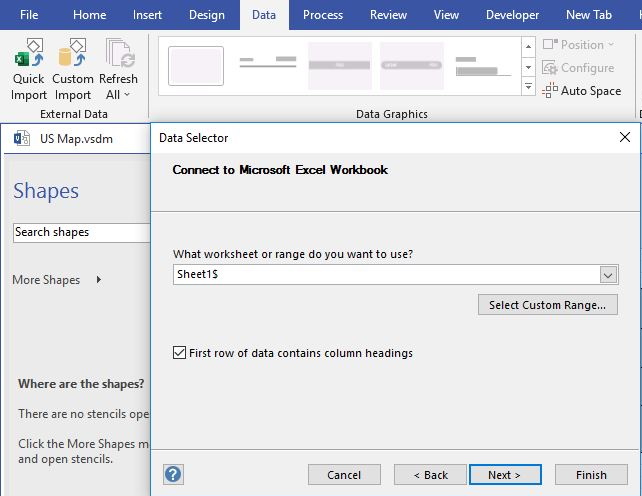
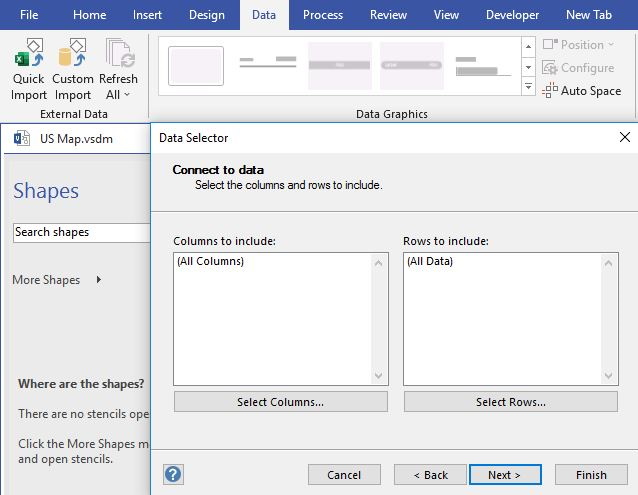
So now it was time to populate the shapes…


I also needed to reflect the Shape Data within the shapes. This was done by inserting fields with Shape Data-Initials and Shape Data-Count. Most of the shapes used Initials over Count, but a few needed to be arranged to fit better or be off shore because of limited space. This was easily done with the Text Block tool.
I also added the Region as a Data Graphics using Colour by Value.
Here is the result.

John… Visio MVP in x-aisle
JohnVisioMVP.ca
