There was a recent request in https://visio.uservoice.com/ about Distribute connectors vertically and horizontally and it sounded like an interesting shape to create. It is basically a 1-D shape (a line that is attached to a 2-D shape to add connection points.)

The shape has fifteen connection points, but uses Shape Data to make from 1 to 15 connection points visible. If the Shape Data is set to less than fifteen, the extra connections are still there, but “hidden” (They map on the last “visible” connector). As the number of connection points change they remain equally spaced.
The 1-D shape is added between two connection points on a 2-D shape. As the 2-D shape is stretched, the 1-D shape is stretched.
So, how hard was it to create? Actually it was relatively easy to create, just a matter of creating a horizontal line and adding three extra section, Shape Data, User and Connections. The specific changes are in green, all the other values are default.
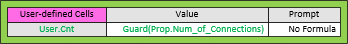
The Shape Data Section is how the user interacts with the shape to let the shape know how many connection points to display.

The next section is the User Section. It is not really necessary, but it is a safety feature when dealing with formulas. If you have formulas that use references to things in other shapes, breaking that reference can mean the formulas are hosed. This is common in ungrouping grouped shapes. Ungrouping destroys the connection. Using User cells means the formulas are untouched and the references can be restored by grouping and adding the new reference to the User cells.
Finally, where the magic happens, the Connection Points section.
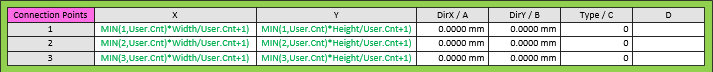
As you can see only the X and Y values are unique, the rest of the cells are default values. I have only shown the first three rows, the rest of the fifteen rows have similar formulas only differing in the row number.
So the formula is just the Width or Height of the line divided by number of points plus 1. So, if you want three points, the line has to be divided into fourths. It is a horizontal line, but if it ins tilted or vertical, the height if the line is also a factor. To allow for fifteen connection points, the formula starts with MIN(1,User.Cnt) so that only connection points 1 to User.Cnt are visible. The other connection points are still there, but they are invisible. Actually, the extra connection points are on top of the UserCnt connection point. Since you are only connecting to them rather than moving them, they remain hidden.
For those adventurous try adding this as a feature to one of your shapes. Remember to keep the X and Y and find a suitable replacement for the Height.
I have saved a copy of the Connection Strip shape to the Download Page.
I hope this helps.
John… Visio MVP in x-aisle
JohnVisioMVP.ca
